
Twitter Feed
So much to blog ….Entry for April 19, 2008
When I started this yesterday, I had a list of about five things I wanted to say on this blog. I then decided on a strategy to list topics as…
Hello World ! – May 18, 2008
I’ve been toying with the idea of doing a blog for about six months now. Initially I didn’t see how any of my contributions to the blogosphere would matter to…
- « Previous
- 1
- …
- 71
- 72
- 73
In an important industry contribution, The Open Group has published a white paper on how to build and measure cloud computing return on investment (ROI). Produced by the Cloud Business Artifacts (CBA) project of The Open Group Cloud Computing Work Group, the document:
- Introduces the main factors affecting ROI from Cloud Computing, and compares the business development of Cloud Computing with that of other innovative technologie;
- Describes the main approaches to building ROI by taking advantage of the benefits that Cloud Computing provide; and
- Describes approaches to measuring this ROI, absolutely and in comparison with traditional approaches to IT, by giving an overview of Cloud Key Performance Indicators (KPIs) and metrics
In presenting their model, business metrics were used to translate indicators of cloud computing capacity-utilization curves into direct and indirect business benefits. The metrics used include:
Speed of Cost Reduction;
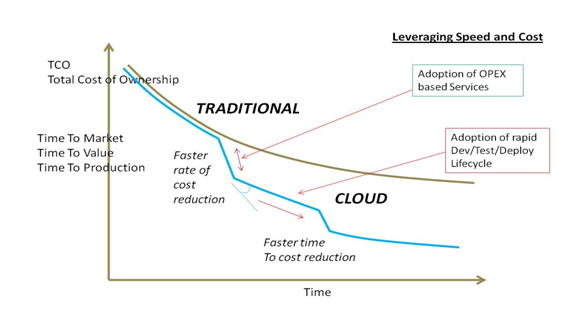
Optimizing Ownership Use;

Rapid Provisioning;

Increase Margin;

Dynamic Usage; and

Risk and Compliance Improvement;

A description of the ROI model used is also provided.

A definite must read!
Available online at https://www.opengroup.org/cloud/whitepapers/ccroi/index.htm

( Thank you. If you enjoyed this article, get free updates by email or RSS – KLJ )
4 Comments
Cloud Computing
- CPUcoin Expands CPU/GPU Power Sharing with Cudo Ventures Enterprise Network Partnership
- CPUcoin Expands CPU/GPU Power Sharing with Cudo Ventures Enterprise Network Partnership
- Route1 Announces Q2 2019 Financial Results
- CPUcoin Expands CPU/GPU Power Sharing with Cudo Ventures Enterprise Network Partnership
- ChannelAdvisor to Present at the D.A. Davidson 18th Annual Technology Conference
Cybersecurity
- Route1 Announces Q2 2019 Financial Results
- FIRST US BANCSHARES, INC. DECLARES CASH DIVIDEND
- Business Continuity Management Planning Solution Market is Expected to Grow ~ US$ 1.6 Bn by the end of 2029 - PMR
- Atos delivers Quantum-Learning-as-a-Service to Xofia to enable artificial intelligence solutions
- New Ares IoT Botnet discovered on Android OS based Set-Top Boxes
Wow, crucial find here Kevin. Their whitepaper has citations (which many information sources forego), and doesnt read like research. It is more on the business side and chock full of visualizations. I wish that the visualizations were described and labeled a little more accurately, and that the data in the diagrams was backed by some solid data. Despite, its a great read for convincing business execs, or convincing your wallet to invest money into these companies.
My Cloud and tech blog:
http://digitalcooings.wordpress.com
Yes, WOW. The numbers are flawed. They are based upon cpu clock cycles, but ignore the AMOUNT OF WORK PERFORMED PER CLOCK CYCLE. This is very misleading. Take Azure: $.12 per hour – for what amount of work? A celeron or nehalem? The fudge factor could 100-500% or more because of this. That blows away the marginal gains of the capacity utilization case.
Sorry, this ROI would not pass a good finance team.
Nice Post…
I would like to talk here about a Computing Conference which i attended Recently. I got a complete information about the Cloud computing and its services from the Cloud Computing and Virtual Conference 2009 which is the World's largest and virtual conference on Cloud computing. I got a good opportunity to meet and talk with the World's leading experts on Cloud computing.